Plot incremental outcomes on the cost-effectiveness plane
plot_psa_scatter.Rdplot_psa_scatter takes a data.frame of incremental quality-adjusted life-years (QALYs) and incremental costs, as might be obtained from a probabilistic sensitivity analysis, and plots these data on the incremental cost-effectiveness plane.
Usage
plot_psa_scatter(
  data,
  delta_qalys,
  delta_costs,
  currency = "$",
  point_alpha = 0.4,
  point_color = "#0099cc",
  point_shape = 16,
  point_size = 2,
  point_jitter_height = 0,
  point_jitter_width = 0,
  plot_wtp_at = NULL,
  wtp_alpha = 1,
  wtp_color = "#154754",
  wtp_linetype = "dashed",
  wtp_linewidth = 0.5,
  show_mean = TRUE,
  mean_alpha = 1,
  mean_color = "#7a0d66",
  mean_shape = 18,
  mean_size = 3
)
Arguments
- data
A data.frame.
- delta_qalys
Unquoted column name for incremental QALYs.
- delta_costs
Unquoted column name for incremental costs.
- currency
String for the currency symbol. Default is
$.- point_alpha
Numeric value for point opacity. Default is
0.4.- point_color
Point color. Default is
#0099cc.- point_shape
Integer value for point shape. Default is
16. See?pchfor available shapes.- point_size
Numeric value for point size. Default is
2.- point_jitter_height, point_jitter_width
Numeric value for vertical and horizontal jittering. Default is
0(no jittering). Be careful that some key-outcome pairs may not be plotted if there is too much jitter.- plot_wtp_at
Numeric value at which to plot the WTP threshold. By default, this argument is
NULLand the WTP threshold is not plotted.- wtp_alpha
Numeric value for WTP threshold line opacity. Default is
1.- wtp_color
Color for WTP threshold line. Default is
#154754.- wtp_linetype
A valid specification of the WTP threshold line type. Default is
dashed(2). See the ggplot2 documentation for valid options.- wtp_linewidth
Numeric value for the WTP threshold line width. Default is
0.5.- show_mean
Boolean indicating if the mean of incremental QALYs and costs should be displayed (as a point). Default is
TRUE.- mean_alpha
Numeric value for mean point opacity. Default is
1.- mean_color
Color for the mean point. Default is
#7a0d66.- mean_shape
Integer value for mean point shape. Default is
18. See?pchfor available shapes.- mean_size
Numeric value for point size. Default is
3.
Details
Fore more information on the display of incremental outcomes on the cost-effectiveness plane, see, for example, Fenwick et al., 2006.
Examples
library(ggplot2)
df <- data.frame(
d_qalys = runif(1000, -1, 2),
d_costs = runif(1000, -1000, 10000),
country = rep(c("Country A", "Country B"), each = 500)
)
# Standard plot (without WTP threshold)
plot_psa_scatter(df, d_qalys, d_costs)
#> No WTP threshold is plotted.
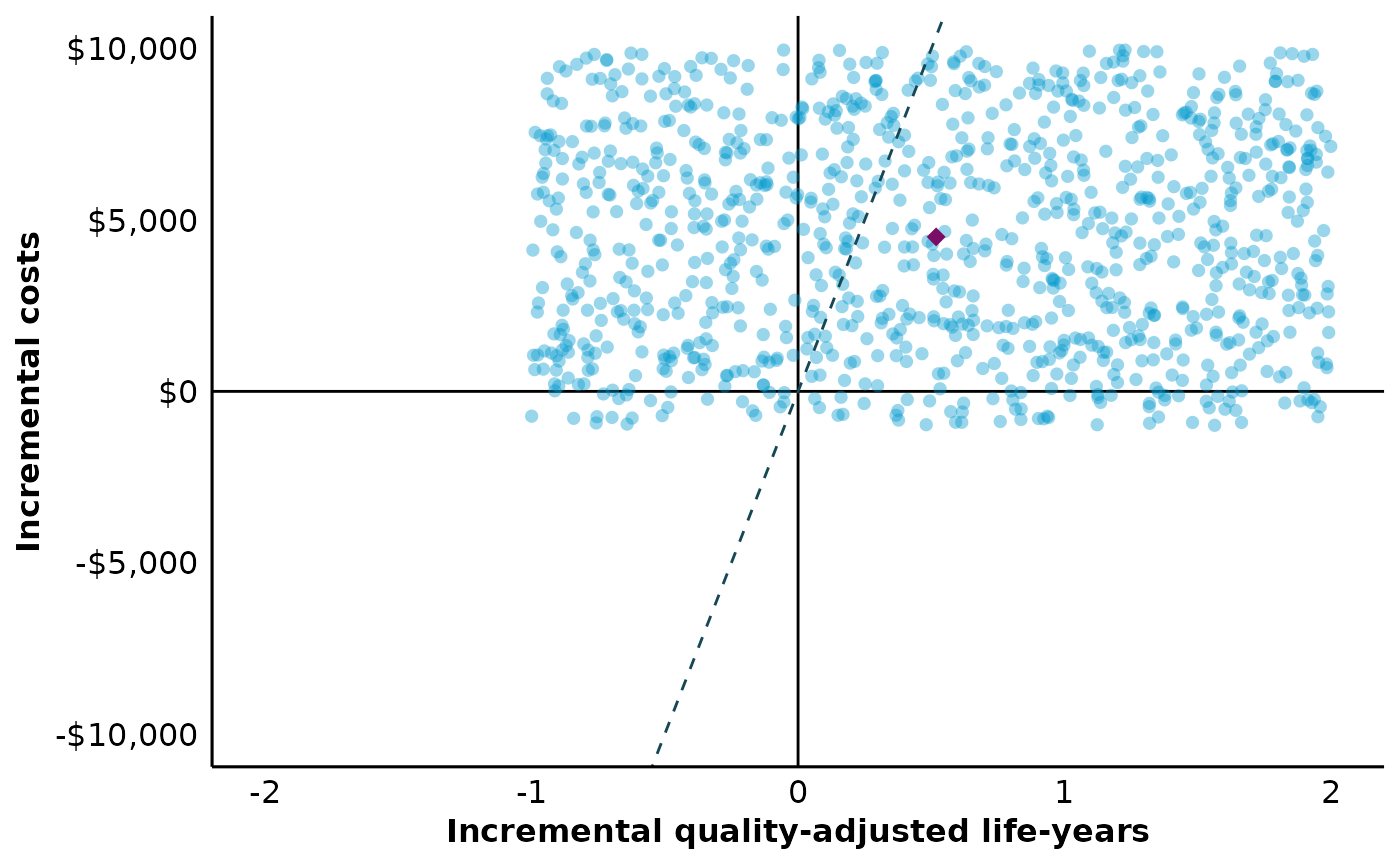
 # Now with a WTP threshold of 20,000
plot_psa_scatter(df, d_qalys, d_costs, plot_wtp_at = 20000)
#> The WTP threshold is plotted at
#> $20000 per QALY gained.
# Now with a WTP threshold of 20,000
plot_psa_scatter(df, d_qalys, d_costs, plot_wtp_at = 20000)
#> The WTP threshold is plotted at
#> $20000 per QALY gained.
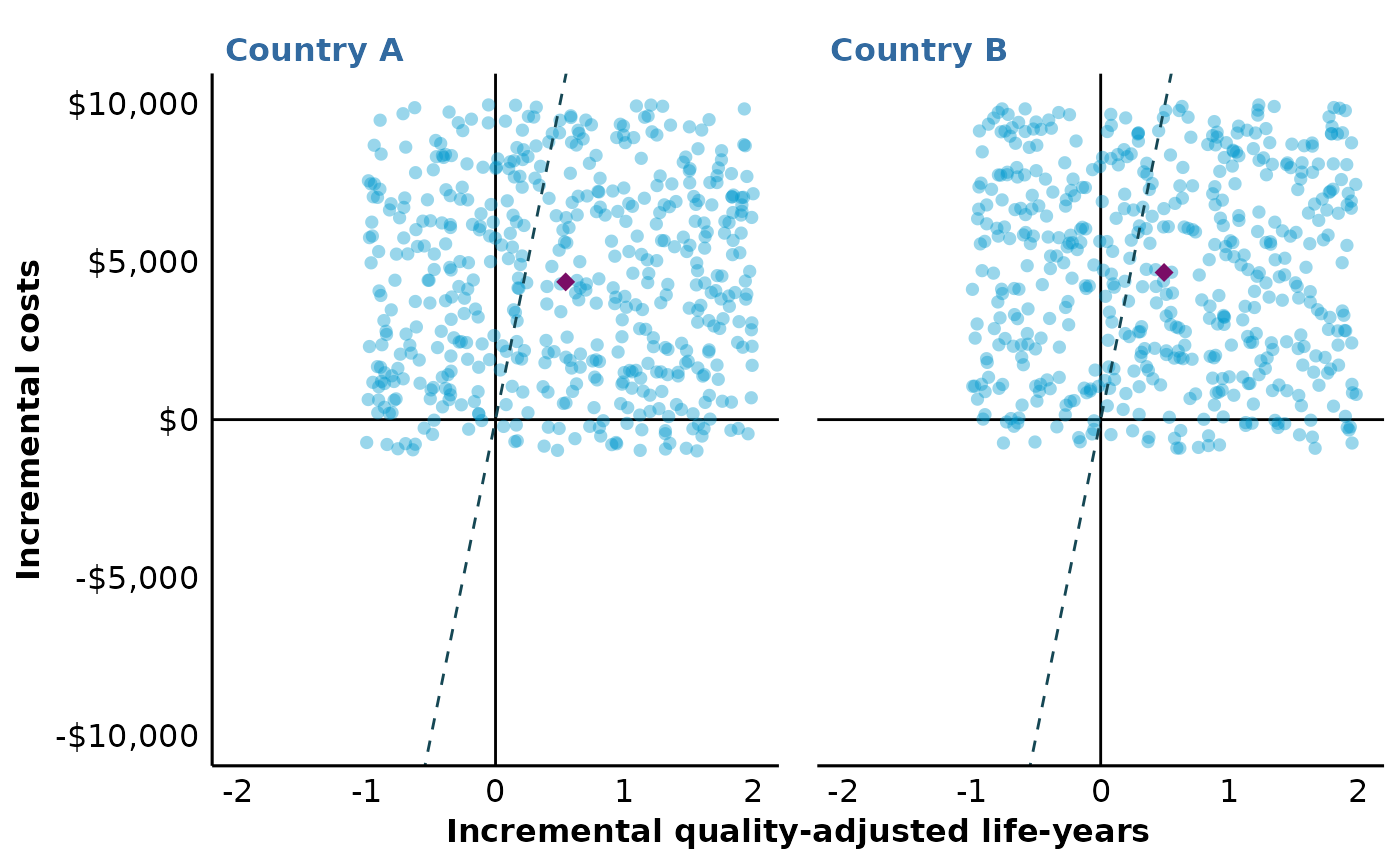
 # Facet plot by adding a call to facet_plot/facet_grid
plot_psa_scatter(df, d_qalys, d_costs, plot_wtp_at = 20000) +
facet_wrap(vars(country))
#> The WTP threshold is plotted at
#> $20000 per QALY gained.
# Facet plot by adding a call to facet_plot/facet_grid
plot_psa_scatter(df, d_qalys, d_costs, plot_wtp_at = 20000) +
facet_wrap(vars(country))
#> The WTP threshold is plotted at
#> $20000 per QALY gained.
 # Don't forget that column names should be unquoted
if (FALSE) {
plot_psa_scatter(df, "d_qalys", "d_costs")
}
# Don't forget that column names should be unquoted
if (FALSE) {
plot_psa_scatter(df, "d_qalys", "d_costs")
}